
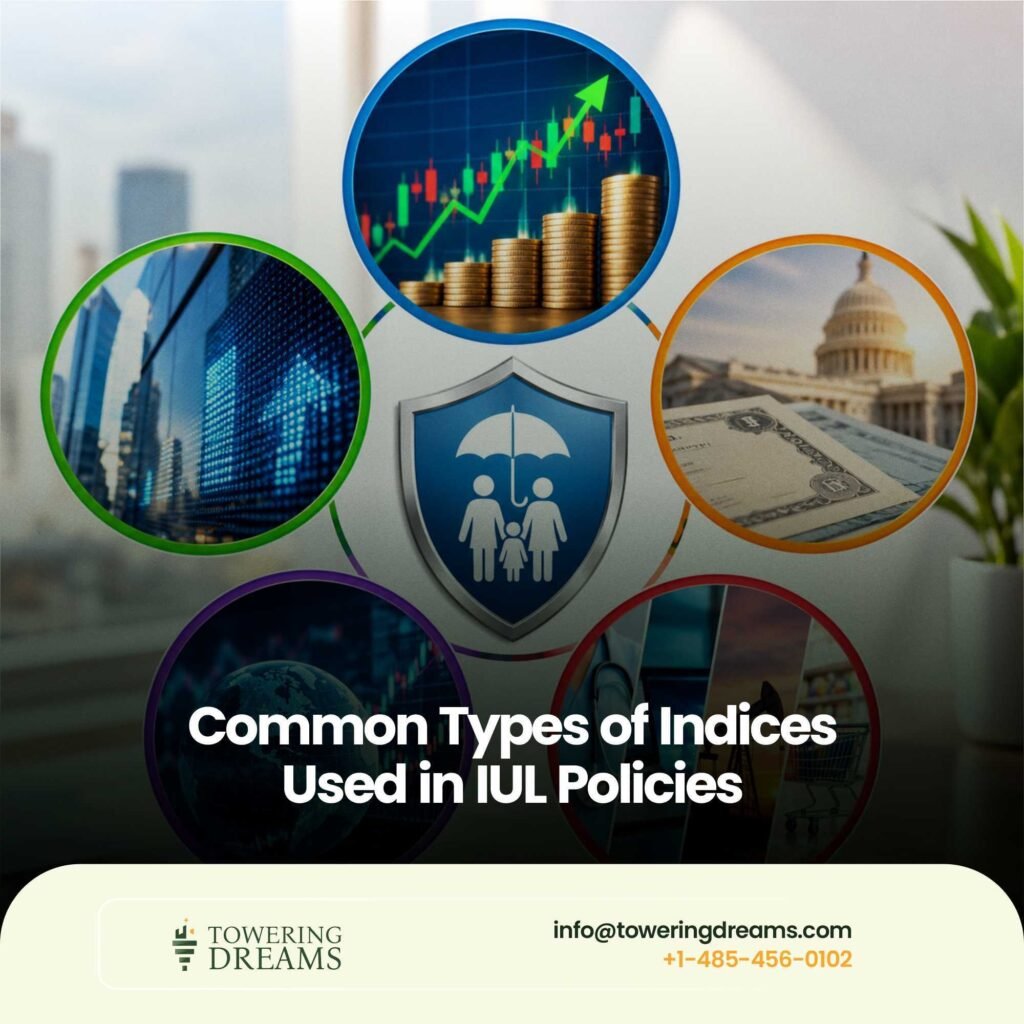
Indexed Universal Life (IUL) insurance has become one of the most talked-about tools in modern financial planning. It pairs a permanent life insurance death benefit with a cash value account that can grow based, in part, on the performance of a stock market index. For families and business owners who want protection, tax-advantaged accumulation and some protection from market losses, that combination is appealing.
But the word “indexed” is often misunderstood. An IUL policy is not invested directly in the stock market, and the policyholder does not own shares of any index. Instead, the insurance carrier uses the movement of a chosen index as a reference point to calculate the interest credited to the policy’s cash value. Which index is selected, and how it is applied, can have a significant effect on long-term results.
This article explains the most common types of indices used in IUL policies, how they differ, and what to consider when choosing between them.
Summary
IUL policies typically offer a menu of index options. The most widely used is the S&P 500, followed by the Nasdaq-100, and many carriers also offer international, small-cap and blended indices. A growing category is the volatility-controlled index, which is designed to smooth out the ups and downs of the market and often comes with more generous crediting terms.
No index is universally best. Each has its own balance of growth potential, volatility and cost, and each is paired with a crediting method and with caps, participation rates or spreads that determine how much of the index gain reaches the policy. A well-designed IUL strategy often allocates cash value across more than one option and reviews that allocation regularly.
How Indices Work Inside an IUL Policy

Before comparing individual indices, it helps to understand the mechanics. Each policy anniversary, the carrier measures how the selected index performed over a set period. If the result is positive, a portion of that gain is credited to the policy’s cash value. If the result is zero or negative, the policy is typically credited a floor, which is commonly 0%, meaning the cash value does not lose money because of index declines. Policy charges and fees are still deducted, so the account value can fall in a weak year even when no loss is credited.
The portion of the gain that is credited depends on a few levers. A cap sets the maximum rate that can be credited in a period. A participation rate sets the percentage of the index gain that counts. A spread, sometimes called a margin, is a percentage subtracted from the gain before crediting. Carriers may use one or a combination of these, and they can adjust non-guaranteed terms over time within the limits stated in the contract.
Because these levers vary so much, two policies tied to the same index can perform very differently. That is why the index itself is only one part of the picture.
The S&P 500 Index

The S&P 500 is by far the most common index in IUL policies. It tracks 500 large publicly traded companies in the United States and is widely regarded as a benchmark for the broader American stock market. Almost every carrier offers it, and it is often the default allocation in policy illustrations.
Its popularity comes from familiarity, transparency and diversification. Because it spans many industries, no single company can dominate the result, which tends to make its behavior less extreme than narrower indices. Historical data is extensive, which lets carriers and advisors model how different caps and participation rates might have performed in the past.
The trade-off is that the S&P 500 price index does not include dividends, so the credited return reflects price movement only. Caps on S&P 500 accounts are also often lower than those on some alternative indices, since the carrier’s cost to hedge it is relatively high. It remains the core holding for many policyholders who want broad, understandable exposure.
The Nasdaq-100 Index

The Nasdaq-100 follows 100 of the largest non-financial companies listed on the Nasdaq exchange, with a heavy weighting toward technology and growth-oriented businesses. Many carriers offer it as a companion to the S&P 500 for those who want greater upside potential.
Historically the Nasdaq-100 has experienced larger swings than the S&P 500, with stronger rallies in favorable periods and sharper declines in weak ones. Within an IUL, the floor protects against negative credits, so the main concern is how often the index finishes a period in positive territory and by how much.
Because of its higher volatility, carriers sometimes set different caps or participation rates for the Nasdaq-100. It can suit policyholders with a longer time horizon who are comfortable with a more concentrated exposure to the technology sector, ideally as part of a diversified allocation rather than as the only choice.
The Dow Jones Industrial Average, Russell 2000 and MSCI EAFE

Beyond the two best-known U.S. options, many carriers offer additional equity indices to broaden diversification. The Dow Jones Industrial Average tracks 30 well-established large companies and is weighted by share price. It is more concentrated than the S&P 500 and is offered less frequently, though some carriers include it for its familiarity.
The Russell 2000 represents smaller U.S. companies. Small-cap stocks can behave differently from large caps, with the potential for stronger growth during certain economic phases and greater sensitivity in others. Including it can add a different source of return to an IUL allocation.
The MSCI EAFE index covers developed markets in Europe, Australasia and the Far East, giving policyholders exposure outside the United States. International indices can help reduce reliance on one economy, although their long-term performance has varied relative to U.S. markets. These options are usually not the primary allocation, but they can add useful variety.
Volatility-Controlled and Hybrid Indices

A fast-growing category in IUL design is the volatility-controlled index. These are proprietary indices, often developed in partnership with major financial institutions, that combine an equity index with a rule-based mechanism that shifts exposure toward lower-risk assets such as cash or bonds when market volatility rises. The goal is to target a steadier level of risk.
Because these indices are less costly for carriers to hedge, they are frequently paired with higher caps or participation rates than standard indices. That is part of why they appear prominently in illustrations. The trade-off is that the volatility control can also reduce gains during strong, fast-moving rallies, and the index may lag a standard benchmark in those periods.
Hybrid or blended indices combine several asset classes, such as equities, bonds and commodities, into a single reference index. These are often more complex, and many have shorter track records or simulated back-tested histories rather than long real-world performance. Policyholders should ask how the index is constructed, what fees or costs are embedded in it, and how much of its history is hypothetical.
Crediting Methods: How the Index Is Measured

Choosing an index is only half of the decision. The crediting method determines how the index movement is measured, and it can change results significantly even when the index is identical.
Annual point-to-point is the simplest and most common method. It compares the index value at the start and end of the policy year, ignoring everything in between. If the final value is higher, a gain is calculated and the cap or participation rate is applied. This method can benefit from strong year-end finishes but misses the effect of intra-year swings.
Monthly averaging takes the average of the index value at each month’s end across the year and compares it with the starting value. This smooths out sudden spikes and drops, but in rising markets the average usually trails the final value, which can lower the credited gain. Monthly sum, sometimes called monthly point-to-point, adds up each month’s gain or loss, with a monthly cap on gains while losses count in full, and the total is credited if positive. It can work well in steady markets but may be hurt by a single sharply negative month.
Many carriers allow policyholders to pair different indices with different crediting methods, which makes it possible to build a more personalized strategy.
How to Choose the Right Index Mix

The right selection depends on the policyholder’s goals, time horizon and comfort with variability. Someone focused on predictable growth may lean toward the S&P 500 or a volatility-controlled option. Someone with a long time horizon who accepts more variability might add the Nasdaq-100 for growth potential. Adding international or small-cap exposure can further diversify.
It is also worth looking beyond the index name. Compare the current caps, participation rates and spreads, along with the guaranteed minimums stated in the contract. Ask how often the carrier can change non-guaranteed terms and what has happened historically. Be cautious about illustrations that assume the highest possible rate on the highest-cap index for decades, since actual results will vary and are not guaranteed.
Finally, review the allocation regularly. Most policies allow reallocation at each anniversary, so the mix can be adjusted as goals, market conditions and carrier terms change. A licensed professional who can model several scenarios, including conservative ones, is well placed to help.
You can always book a free strategy session with us. We will be glad to help you set up a policy and to help you make the most of it to achieve your aims and objectives.
Conclusion
The index behind an IUL policy is a reference point, not an investment, but the choice still matters. The S&P 500 provides broad and familiar exposure, the Nasdaq-100 offers more growth-oriented potential with greater variability, and additional equity indices add diversification. Volatility-controlled and hybrid indices aim for steadier results, often with more attractive crediting terms, while the crediting method shapes how the index movement turns into credited interest.
Understanding these building blocks makes it easier to read an illustration critically and to build an allocation that fits the policy’s purpose. As with any long-term financial product, working with a qualified professional and reviewing the strategy periodically will help the policy stay aligned with your goals.
Indexed Universal Life Insurance(IUL) policies have a lot of features that can potentially provide a safety net for you and for your loved ones. You should check out this video on how to safeguard your future and that of your loved ones against unforseen circumstances like job loss or illnesses for more information.
FAQ
Question 1: What is the most common index used in IUL policies?
Answer: The S&P 500 is the most widely offered and most commonly selected index. It tracks 500 large U.S. companies and is available with nearly every carrier, which makes it a familiar starting point for many policyholders.
Question 2: Is my IUL cash value invested directly in the index?
Answer: No. The cash value is not invested in the stock market or in the index itself. The carrier uses the index’s performance to calculate the interest credited, subject to caps, participation rates, spreads and a floor, so you do not directly participate in market losses or gains.
Question 3: What is a volatility-controlled index?
Answer: It is a proprietary index that adjusts its exposure based on market volatility, shifting toward lower-risk assets when markets become turbulent. It often carries higher caps or participation rates, but it can lag standard indices during strong rallies.
Question 4: Can I use more than one index in the same policy?
Answer: Yes. Most carriers allow you to divide your cash value among several index accounts and, in many cases, a fixed account. This lets you diversify across indices and crediting methods, and you can usually reallocate at each policy anniversary.
Question 5: Does the index I choose guarantee a certain return?
Answer: No. Index performance, caps, participation rates and spreads are not guaranteed beyond the minimums stated in your contract. Illustrations show projections based on assumptions, so it is wise to review conservative scenarios as well.

At Towering Dreams we help American families to choose the right type of Indexed Universal Life ( IUL ) & Annuity plan.